Marketing attribution, explained
How to work out which marketing is bringing you customers, and what to do when the numbers disagree.
Book a call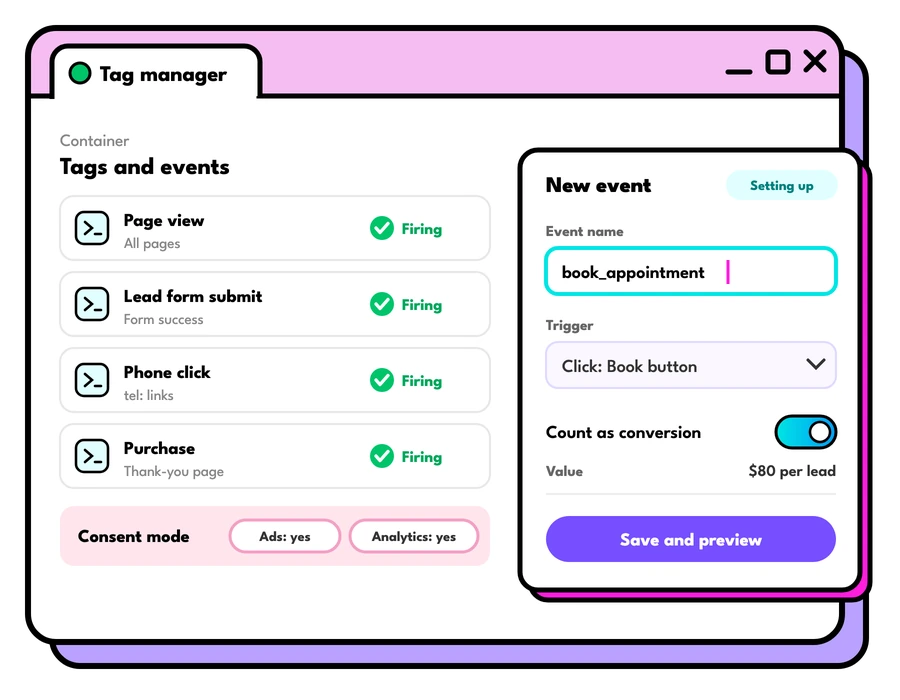

Marketing attribution is how you give credit for a sale or a lead to the marketing that led to it. Someone might see your ad on Instagram, search for you a week later, click a Google ad and then buy from an email. Attribution decides how much each of those steps counts.
It matters because whatever gets the credit usually gets the budget. Get attribution wrong and you can end up cutting the marketing that's doing the hard work out of sight.
Why Google, Meta and Analytics never agree
Each platform measures its own results, and each one is generous to itself. Run ads on Google and Meta and add up the sales each claims, and you'll often get more sales than you actually made.
One big reason is the lookback window: how far back a system looks for a click or view before a sale. Michelle Bourke, our founder, explained it in 2019: “If you have a long sales and decision making cycle, make your Lookback Window longer. If you don’t, make it shorter. For example, if you’re selling houses - a 90+ day lookback window is ideal. If you’re selling groceries, it might only be 7 days!”
Platforms also measure differently. Google Analytics, Google Ads and Meta each use their own models and windows, so the same customer can be counted three ways. In Google Ads, the click-through conversion window is 30 days by default and can go up to 90 days for Search, depending on the conversion source. Google Analytics 4 looks back 90 days by default for most key events. Treat each platform's numbers as one view, and judge it against the results in your own sales or CRM data.
Which marketing attribution models can you use?
- Last click. All the credit goes to the final click before the sale. Simple, but it overrates search and email and underrates everything that came first. It's still available in Google Ads and Google Analytics 4.
- First click. All the credit goes to the first click. Useful for seeing what starts journeys, but blind to what closes them. Google retired first click, linear, time decay and position-based models in Google Ads and Google Analytics 4 in 2023, saying fewer than 3% of Google Ads web conversions used them. You'll now find these models only in other analytics and attribution tools.
- Linear. Credit is shared equally across every step. Retired from Google's tools in 2023.
- Time decay. Steps closer to the sale get more credit. Also retired from Google's tools in 2023.
- Data-driven. The platform uses its own data to estimate each step's contribution. It's the default in Google Ads and Google Analytics 4, and since 2023 it's the only shared-credit model left in both. It's a sensible place to start, though it still only sees what Google sees.
Give every channel its fair share
Michelle's example from 2019 still holds. Johnny clicks a Facebook ad, and twenty days later searches for the brand and buys. Facebook's reports say Facebook made the sale; Google Analytics says it was search. Both teams celebrate. In her words: “If someone became aware of the company via Facebook and that was the reason they searched later on, then both channels deserve some credit. If we don’t acknowledge Facebook’s role in the sale, then we start thinking that our brand awareness marketing doesn’t matter and we try to focus only on the things that drive the final click.”
The same thing happens with email. Email customers convert well because they're already close to buying. The useful question is what brought them onto your list in the first place.
How to set up attribution you can trust
- Decide what you're trying to learn first. Michelle again: “just because it CAN be tracked, doesn’t mean it SHOULD be tracked.” Start with the decisions you need to make, such as where to put next quarter's budget, and track what answers them.
- Get the basics right. Google Analytics 4 and Tag Manager on every page, conversions set up for real sales and real leads, and the Meta pixel and Conversions API sending the same events.
- Follow leads through to sales. For a lead generation business, the lead is only half the story. Connect your forms and calls to your CRM so you can see which channels bring in leads that turn into customers.
- Set lookback windows to match how long people take to decide. Weeks for a quick purchase, months for a house, a car or business software.
- Compare platforms with your own numbers. Check each platform's claimed sales against your actual sales each month, and watch the trend more than the exact figure.
- Ask your customers. A one-question survey after purchase, "Where did you first hear about us?", fills the gaps no tracking can see: word of mouth, podcasts, a friend's recommendation, an AI tool.
Allow for the delay before results settle
Sales and leads keep arriving in your reports for days or weeks after the click that started them. Last week's cost per lead almost always looks worse than it will once all the conversions are counted. Before you compare periods, measure how long your conversions take to come in, and compare windows that have had that long to settle.
Aim for good enough to decide
People switch devices, clear cookies, decline tracking and talk to each other offline. As Michelle put it, “While tracking is never 100% accurate, it’s a whole lot better than nothing at all.” The aim is a picture good enough to decide where the next dollar goes, checked from more than one angle.
Want a second opinion on your tracking? It's part of our Google Analytics consulting, and our free AI visibility check looks at your site's tracking too.
Single-touch and multi-touch attribution
Attribution models fall into two groups. Single-touch attribution gives all the credit to one touchpoint in the customer journey: first click or last click. Multi-touch attribution shares the credit across several touchpoints, using linear, time decay, position-based or data-driven rules. In Google Ads and Google Analytics 4, data-driven is now the only multi-touch option.
Position-based attribution, sometimes called U-shaped, gives most of the credit to the first and last steps and splits the rest across the middle. It suits businesses that value both the channel that introduced the customer and the one that closed the sale. Google no longer offers it, so you'd need a separate analytics or attribution tool to use it.
Sharing the credit gives a fairer picture of the impact of channels that open and nurture the customer journey, such as video, social and content. It still has limits. It only sees the clicks and views it can track, each platform only sees its own part of the journey, and it can't see a conversation at a barbecue or a radio ad in the car.
Attribution across the customer journey
Different views suit different questions, so match the view to the stage of the customer journey you're judging:
- Top of the funnel: first-touch reports and growth in brand searches show what starts journeys.
- Middle of the funnel: shared-credit or data-driven reports show which channels keep people engaged while they compare.
- Bottom of the funnel: last-click reports are useful for tuning search terms, landing pages and offers, as long as you remember they leave out everything earlier in the journey.
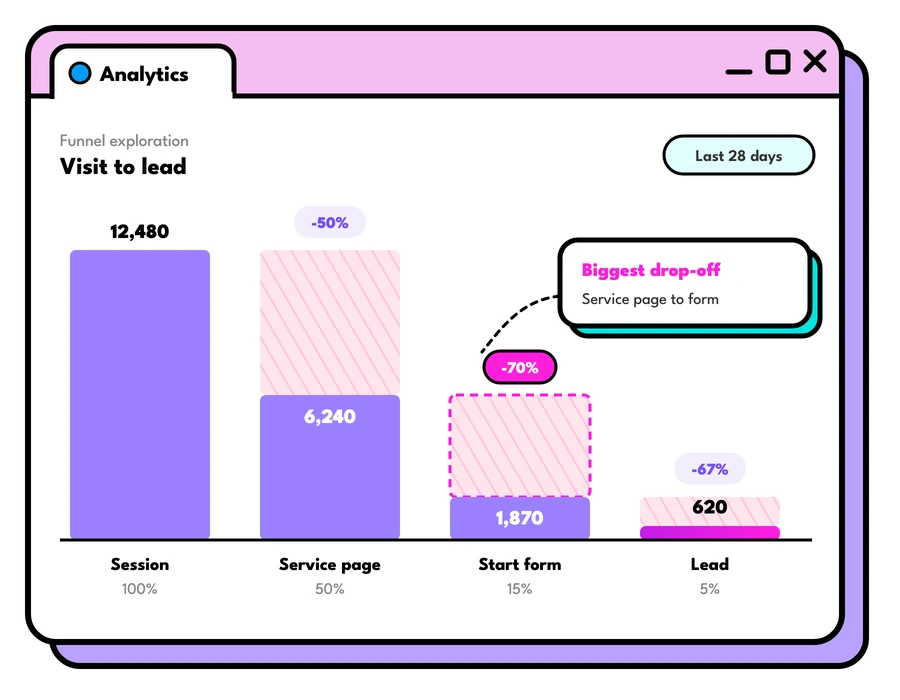
Our guide to the marketing funnel explains each stage of the customer journey and how to measure it.
Marketing mix modelling: measuring and planning
Marketing mix modelling (MMM) takes a step back from individual clicks. It uses statistics to compare a long run of weekly spend in each channel with your total sales, while allowing for outside factors such as seasons, price changes, promotions and public holidays. From that, it estimates how much each channel adds to sales.
Because it uses totals, MMM works without cookies or tracking of individual people. It can include TV, radio, outdoor, print and other offline spend, which click-based attribution can't see.
As a measurement tool
MMM looks backwards and estimates the impact each channel had on sales over the period, and the return on what you spent there. It answers questions such as "How much did our video campaigns add last year?"
As a planning tool
MMM can also look forwards. Because the model learns how sales respond to more or less spend in each channel, you can try scenarios before you commit: what happens if we move some budget from search to video, and at what point does extra spend in a channel stop paying off? Treat these forecasts as estimates to test, and check them against real results.
MMM suits businesses with a good history of spend and sales data across several channels. Free, open-source tools now exist, such as Google's Meridian and Meta's Robyn, but you still need someone who can prepare the data and check whether the model's answers make sense.
Measure impact with incrementality tests
An incrementality test, also called a lift test, measures the sales a channel adds by comparing a group that sees your ads with a similar group that doesn't. It's the closest thing marketing has to a controlled experiment.
- Platform lift studies. Google and Meta both offer conversion lift studies for eligible advertisers, which hold back a random group of people from seeing your ads.
- Regional tests. Pause or increase a channel in some regions and keep it steady in others, then compare sales.
Here's a hypothetical example. Say a retailer with stores in Melbourne and Brisbane wants to know whether its YouTube campaign is working. It runs the campaign in Melbourne only for six weeks and compares sales growth in both cities against the same weeks last year. The difference is a rough measure of the campaign's impact, far more convincing than either platform's own report.
How the three methods fit together
- Attribution is for day-to-day and week-to-week decisions within channels: which keywords, ads and audiences to back.
- Marketing mix modelling is for quarterly and yearly decisions about how to split your budget across channels.
- Incrementality tests settle arguments between the two, and check that the model's estimates hold up in real life.
Smaller businesses can start with attribution and a post-purchase survey, then add a simple regional test before they ever need a model.
Attribution challenges and how to handle them
- People switch devices. Someone sees your ad on a phone and buys on a laptop. Signed-in data, enhanced conversions in Google Ads and the Meta Conversions API help connect the steps.
- Privacy and consent. Cookie banners, browser limits and app tracking choices mean some people can't be tracked. Platforms fill gaps with modelled conversions, so expect estimates in your reports alongside counts.
- Phone calls and offline sales. Use call tracking, and import closed sales from your CRM into Google Ads and Meta, so the platforms learn which leads turned into customers.
- Long sales cycles. If people take months to decide, short lookback windows miss the start of the customer journey. Set windows to match how long your customers take.
- Double counting. Each platform claims the sales it touched. Compare their totals with your real sales every month.
- View-through credit. Some platforms count sales from people who only saw an ad. Report these separately from click-based sales, and use a lift test if they make up a big share.
How each model splits the credit: a worked example
Running one sale through each marketing attribution model shows how much the choice of model changes the story. Here's a hypothetical example. Say a customer buys a $1,200 sofa after four touchpoints: an Instagram ad, a visit from Google's free results, a click on a Google ad and a click in an email.
- Last click: the email gets all $1,200 of credit.
- First click: the Instagram ad gets all $1,200.
- Linear: each touchpoint gets $300.
- Position-based: with a common 40/20/40 split, the Instagram ad and the email get $480 each, and the two Google touchpoints get $120 each.
- Data-driven: there's no fixed rule. The model compares paths that led to a sale with paths that didn't, using your account's own data, and shares the $1,200 accordingly.
Under last click, Instagram looks worthless and might be cut. Under first click, email looks worthless. Neither is the whole truth, which is why it pays to compare more than one view before you move budget, and to check them all against your real sales.
The short version
Attribution tells you which of your marketing gets credit for each sale. Use a multi-touch or data-driven model so the whole customer journey is counted, check every platform against your own sales, and let results settle before you judge them. As your spend grows, add incrementality tests and, eventually, marketing mix modelling, so your budget decisions rest on more than one view of the truth.


Questions people ask
What is marketing attribution in simple terms?
It's how you decide which of your marketing gets credit for a sale or lead, so you know where your budget is working.
Which attribution model is best?
There isn't one right answer for every business. Data-driven attribution is a sensible default in Google, but always check it against your own sales data and a simple customer survey.
Why do my Facebook and Google results add up to more sales than I made?
Each platform credits itself for any sale it touched within its own lookback window, so one sale can be counted by both. Compare each against your real sales to see the true picture.
Do I need attribution software?
Most businesses don't to begin with. Analytics, well set up conversions, a CRM connection and a post-purchase survey answer most questions. Specialist tools earn their keep once you're spending across many channels.
What is multi-touch attribution?
A way of sharing the credit for a sale across several steps in the customer journey, such as a social ad, a search and an email, so every channel that helped gets some of the credit.
What is the difference between attribution and marketing mix modelling?
Attribution follows individual clicks and views to give credit for each sale. Marketing mix modelling uses total weekly spend and sales to estimate each channel's impact, including offline channels, and helps plan future budgets.
How do I measure the impact of brand awareness ads?
Watch growth in brand searches and direct visits, ask new customers where they first heard of you, and run a lift test that compares people or regions who saw the ads with those who didn't.
Keep reading
What is a marketing funnel? Stages, examples and how to build one
What a marketing funnel is, its stages, examples for lead generation and ecommerce, and how to build and measure one that brings in customers.
Read the guide
Marketing for small business: where to start
Marketing for small business: where to start, what to spend first, which channels suit a small budget, and the simple tracking that shows what's working.
Read the guide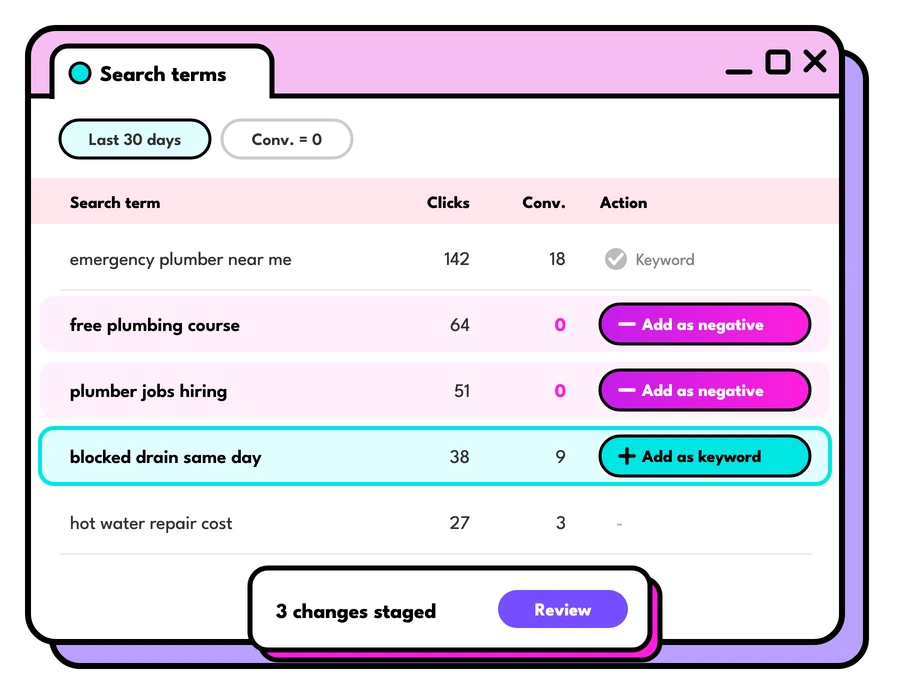
Google Ads search terms report
How to use the Google Ads search terms report to find new keywords, cut wasted spend and win more of the traffic that turns into enquiries.
Read the guideLet's talk about your goals
Tell us what you're working towards and we'll show you where we'd start.
Book a strategy call